Basics · PHW99Verse
Return, Hit Count and Spread Tell Different Stories
A percentage, a count and a description such as “high volatility” answer different questions. Treating them as interchangeable makes an explanation sound precise while concealing what was actually measured. This reading note uses invented point sequences to separate the questions. It does not estimate the odds of any commercial game or suggest that a sequence predicts the next outcome.
Two sequences can return the same total while having different numbers of positive results and different spreads. A small observed sequence is not a game’s theoretical RTP.
Begin with a fully labelled example
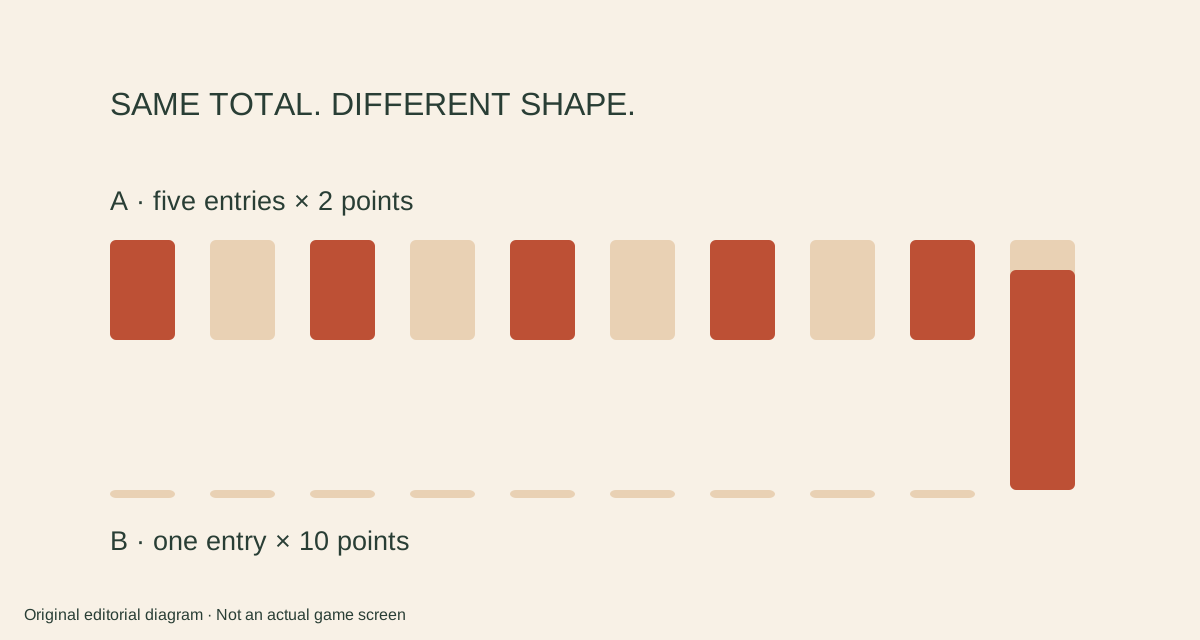
Imagine ten entries, each with one input point. Sequence A returns 2 points on five entries and 0 on five. Sequence B returns 10 points on one entry and 0 on nine. These values are chosen for arithmetic, not sampled from a game. Both sequences have 10 input points and 10 returned points, so each observed returned-to-input ratio is 100 percent.
The sequence reading lab displays every entry and calculates the totals. You can inspect the arithmetic without generating rounds or using money.
A total cannot tell you how the returns were distributed
The matching totals hide a difference. A has five positive entries; B has one. The positive-entry shares are therefore 5 out of 10 and 1 out of 10, or 50 percent and 10 percent. This measure answers how often the invented sample contains a positive value. It does not tell you the long-run frequency of an event in a different system.
Nor does “positive” necessarily mean a net gain. In this example we have stated the input separately so that readers can inspect that distinction rather than assume it.
Spread is another question again
A’s values range from 0 to 2. B’s range from 0 to 10. Relative to the common mean of 1 point, B places more weight in a single distant value. That is a simple description of the chosen numbers’ spread, not an official volatility rating for a slot. We do not translate either range into a low, medium or high label for any provider.
To compare published ratings, you would need to know how each publisher defines the rating and which version the rating describes.
Keep observed arithmetic separate from theoretical RTP
The Australian Institute of Family Studies explanation describes RTP over the long run and explains why an individual’s results can differ from it. Our ten-entry examples are finite illustrations. Calling their observed ratio a commercial game’s theoretical RTP would change both the source and the meaning of the number.
A provider’s published theoretical value, a measured historical result and an invented classroom sequence should each retain their own label. They are not substitute evidence for one another.
Read a number with its question attached
Before comparing two statistics, write the question each answers. “How much was returned in this sample?” differs from “How many entries were positive?” and “How widely did the entries vary?” Then check the units, denominator, time window and source. If one figure is theoretical and another observed, say so before placing them next to each other.
This method is useful beyond games: a shared total can conceal very different distributions. The safe conclusion from our examples is about the arithmetic shown here, not about the chance of winning elsewhere or how long someone should continue playing.
Your reading checklist
- Identify theoretical, observed or invented data
- Keep the denominator
- Count positive entries separately
- Describe spread separately
- Never forecast the next outcome from this sample
Reader questions
Do the examples describe an actual slot?
No. They are invented point sequences whose only purpose is to illustrate different summary measures.
Does an observed 100 percent ratio establish theoretical RTP?
No. A finite example or sample does not establish the probability model of a game.
Sources and scope
- Australian Institute of Family Studies — understanding long-run return
Research explanation of long-run RTP and variation in individual results; not a forecast for a session.